Simple plotting using ggplotnim
Line plot
import ggplotnim
let x1 = @[0.0, 1.0, 2.0, 3.0]
let y1 = @[0.0, 1.0, 4.0, 9.0]
let df1 = toDf(x1, y1)
ggplot(df1, aes("x1", "y1")) +
  geom_line() +
  ggsave("images/line_plot.png")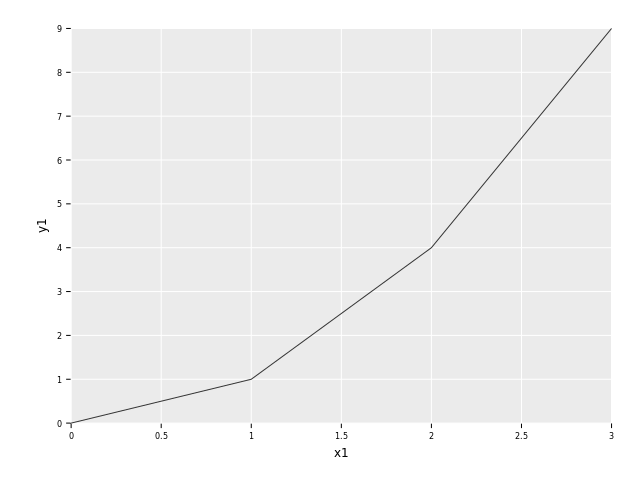
Every plot in ggplotnim is created from an input DataFrame using the ggplot procedure. The aes
argument describes the so called "aesthetics", which are simply the columns of the DataFrame to
visualize. From here a plot is built up "by layers".
Note: the theme_opaque is only used here to give the output PNG a white background so it's more
visible in this book when using dark themes.
Scatter plot
import ggplotnim
let x2 = @[0.0, 1.0, 2.0, 3.0]
let y2 = @[0.0, 1.0, 4.0, 9.0]
let df2 = toDf(x2, y2)
ggplot(df2, aes("x2", "y2")) +
  geom_point() +
  ggsave("images/scatter_plot.png")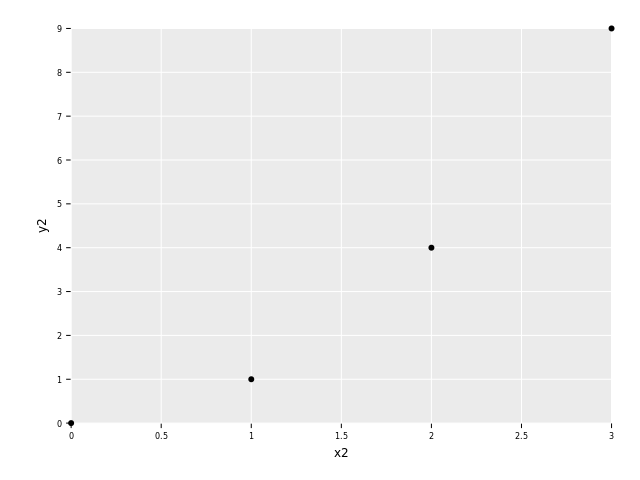
Notice how similar the two code snippets are. This is the general structure of ggplotnim, you add geoms and combine them in different ways.
Try for yourself what happens if you have both geom_line and geom_point.